Foureyes
Sales level out as new inventory levels drop below used
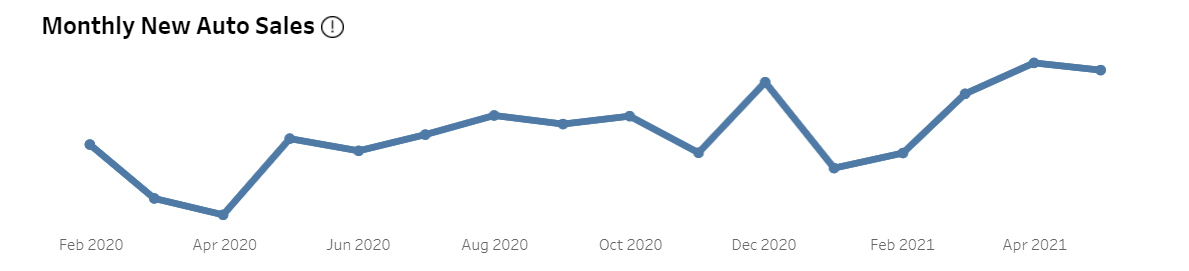
 Despite Memorial Day kicking off summer sales, new auto sales are down 3% MoM as inventory continues to drop. For the first time, franchised dealerships have more used inventory available than new inventory.
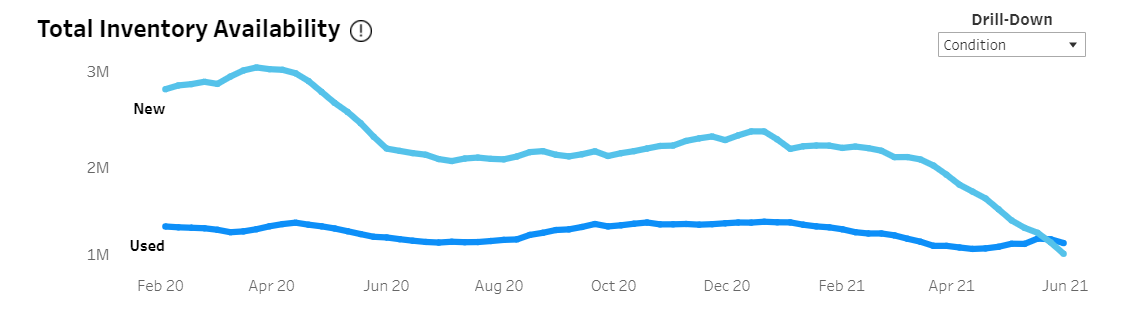
Inventory availability trends are something we report on weekly as supply chain disruptions and computer chip shortages have resulted in inventory levels well below seasonal norms.
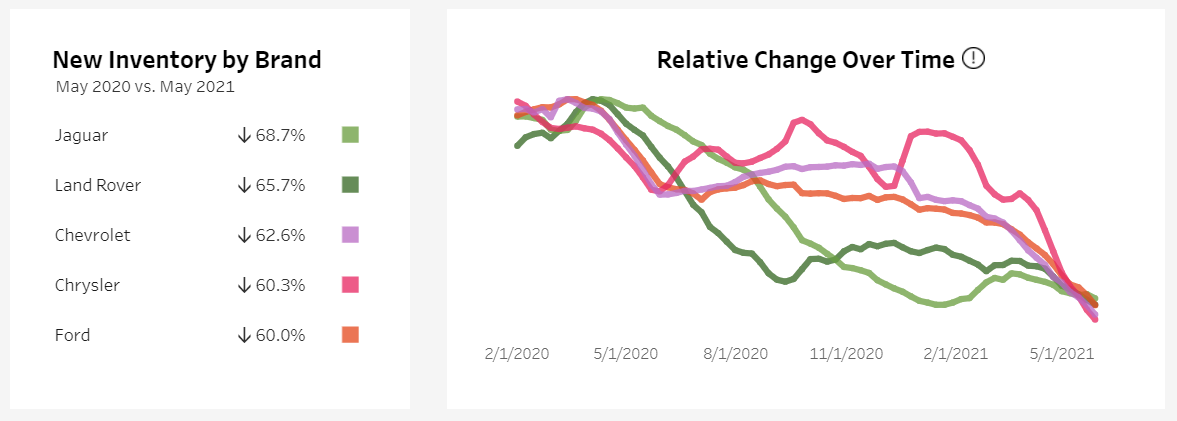
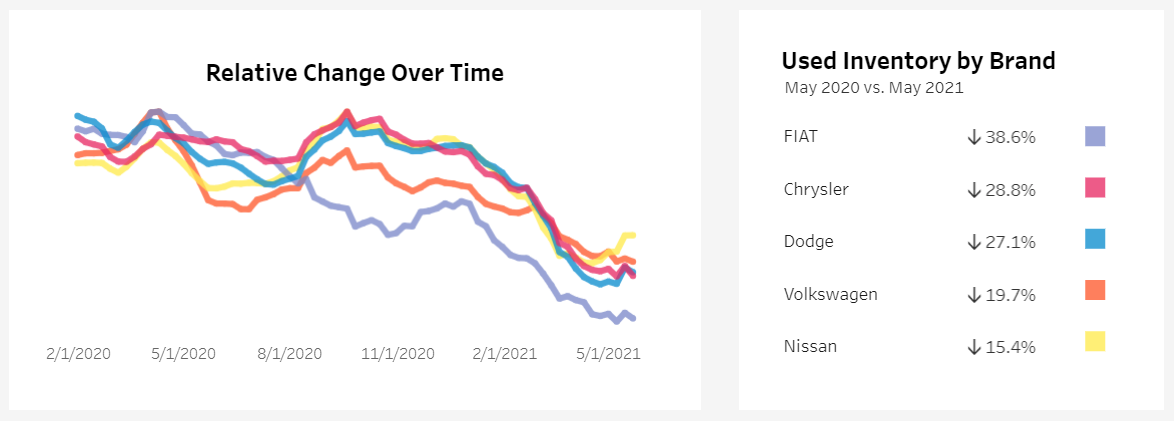
Looking at the 20+ automotive brands that make up the Foureyes dataset, Jaguar, Land Rover, Chevrolet, Chrysler, and Ford have seen the biggest drop in new inventory YoY. FIAT, Chrysler, Dodge, Volkswagen, and Nissan have seen the biggest drop in used inventory YoY.
To learn more about these insights and explore the data for yourself, visit the interactive inventory dashboard, auto sales dashboard, or other free data resources from Foureyes.
Foureyes
State-Specific Auto Sales Data
 Foureyes released a new state-specific data visualization to help you better understand sales trends by metro area, week, and OEM. Explore it here: https://lps.foureyes.io/auto-states-during-covid-19
Similar to the original COVID-19 dashboard and shelter-in-place data, this interactive dashboard enables dealers to understand the effects of novel coronavirus on new and used auto sales. To explore the data, choose a state from the dropdown and hover over the map to review month-over-month sales trends. Double-click or zoom in to see sales performance by ZIP code. Scroll down to review sales performance by metro area, OEM, and week-over week.
Feel free to reach out with any questions.
2 Comments
Automotive Group
Interestingly, it shows us in Las Vegas only being down 0.5%
I have to assume its missing some data
Foureyes
The data is a month-over-month comparison (April vs. March 2020), which may explain the 0.5% decrease. If you have additional questions or want to take a deeper dive into the data, let me know and I'd be happy to set something up.
No Comments