Foureyes
Sales level out as new inventory levels drop below used
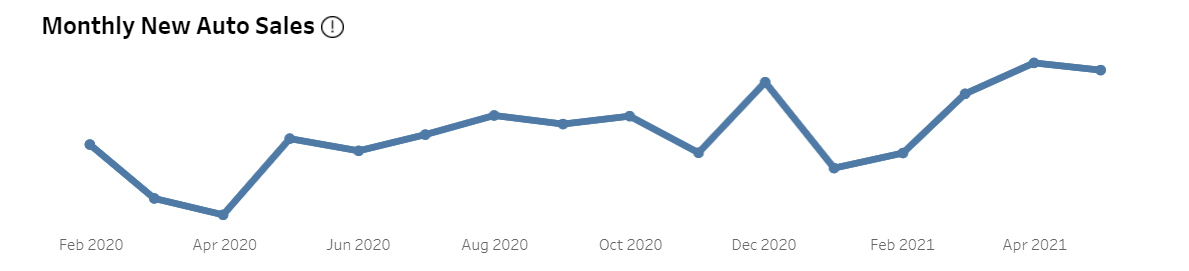
 Despite Memorial Day kicking off summer sales, new auto sales are down 3% MoM as inventory continues to drop. For the first time, franchised dealerships have more used inventory available than new inventory.
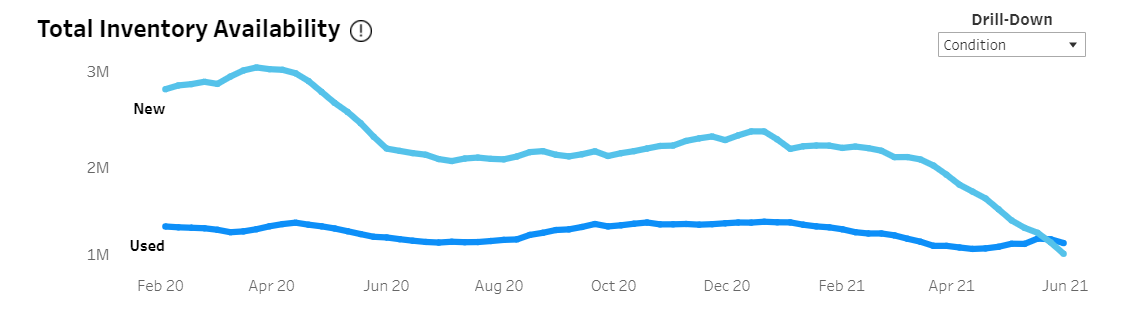
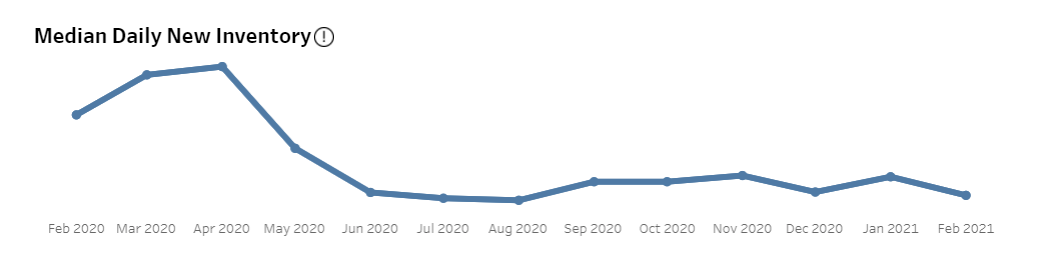
Inventory availability trends are something we report on weekly as supply chain disruptions and computer chip shortages have resulted in inventory levels well below seasonal norms.
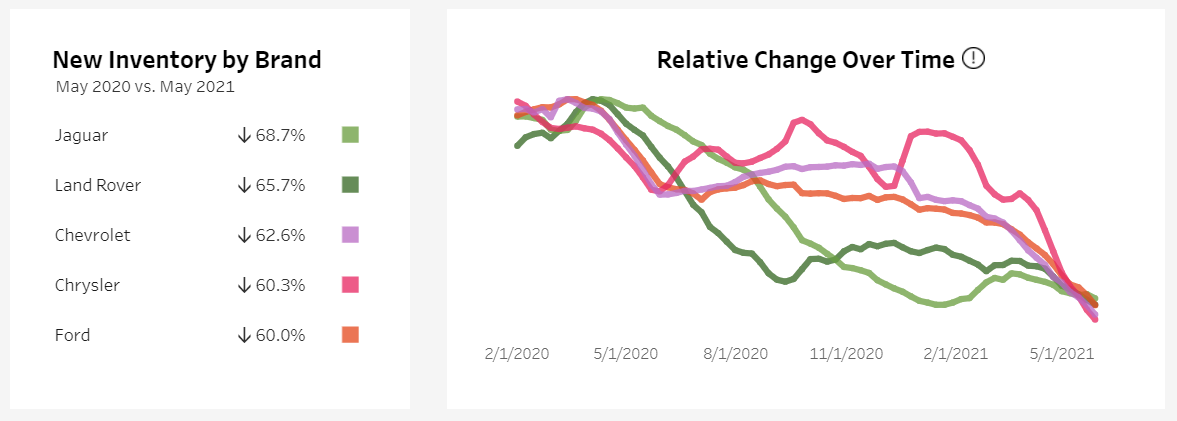
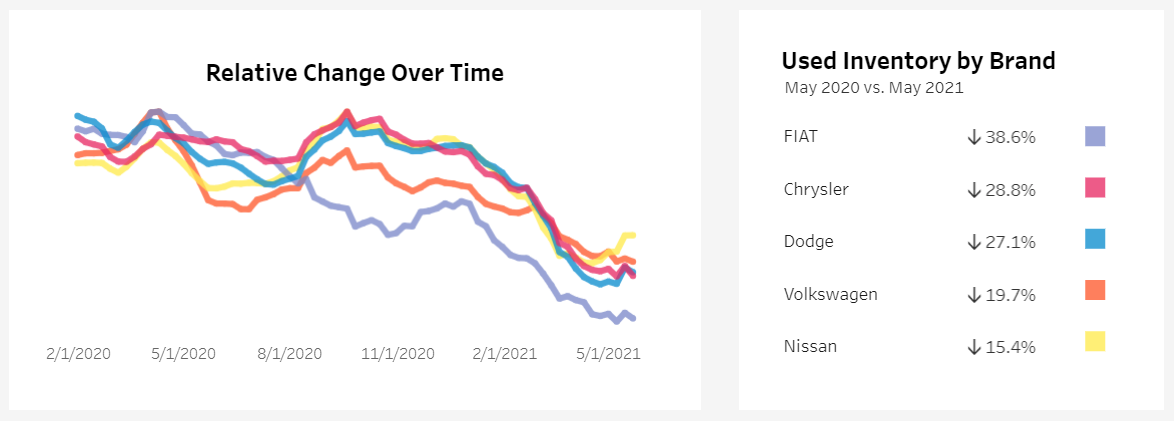
Looking at the 20+ automotive brands that make up the Foureyes dataset, Jaguar, Land Rover, Chevrolet, Chrysler, and Ford have seen the biggest drop in new inventory YoY. FIAT, Chrysler, Dodge, Volkswagen, and Nissan have seen the biggest drop in used inventory YoY.
To learn more about these insights and explore the data for yourself, visit the interactive inventory dashboard, auto sales dashboard, or other free data resources from Foureyes.
Foureyes
Car Sales Data Worth Celebrating
 It should come as no surprise that new car sales are up significantly from March 2020 to March 2021, but that doesn’t stop me from celebrating.
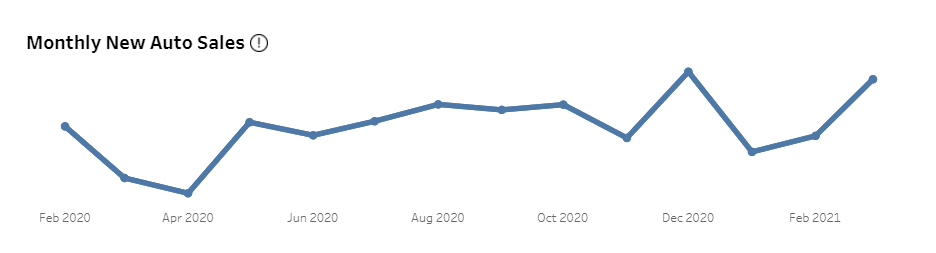
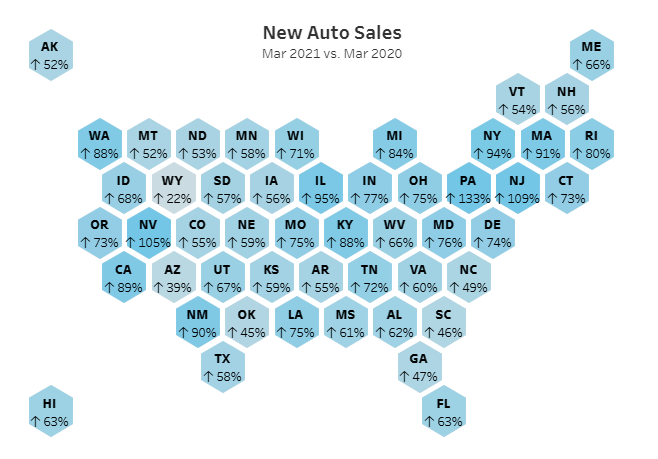
After a tumultuous year, we can see exactly how the auto industry rebounded. Nationally we’re seeing a 32% increase in MoM new car sales and 73% increase in YoY new car sales. State-specific increases range from 22% to 133%, with Pennsylvania (133%), New Jersey (109%), and Nevada (105%) showing the largest YoY jumps in new car sales.
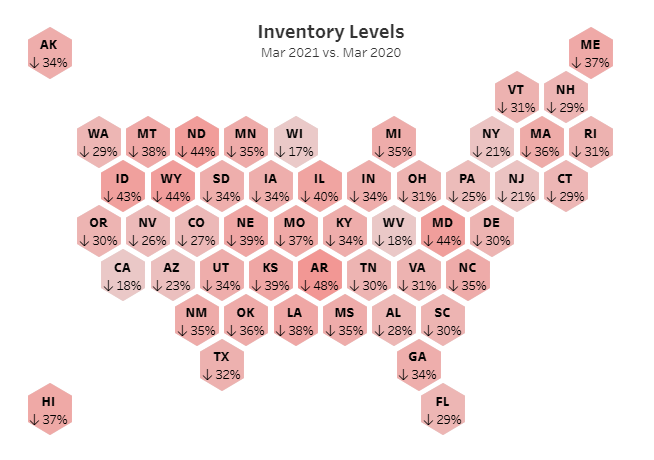
Even with year-over-year inventory levels down 29% nationally, March’s new car sales numbers are the highest we’ve seen so far in 2021. That’s good to see as we head into warmer weather and the busy spring and summer months.
Does this data align with what you’re seeing in your market? How do 2021 sales compare to 2019 and even 2018 numbers at your dealership? Dig into the interactive data from Foureyes to compare specific makes or models and let us know.
No Comments
Foureyes
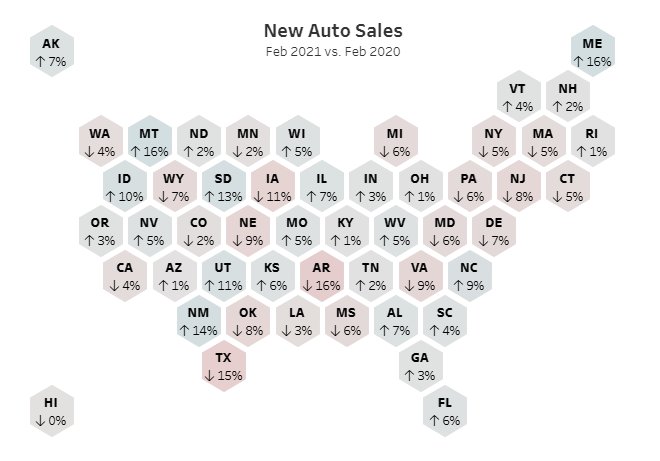
Tracking U.S. New Auto Sales
 To help you monitor auto sales and compare trends month-over-month and year-over-year, Foureyes released a New Auto Sales Report. Updated monthly in line with sales close dates, use the interactive dataset to explore new vehicle sales and inventory levels over time. Review performance nationally or drill down by brand and state.
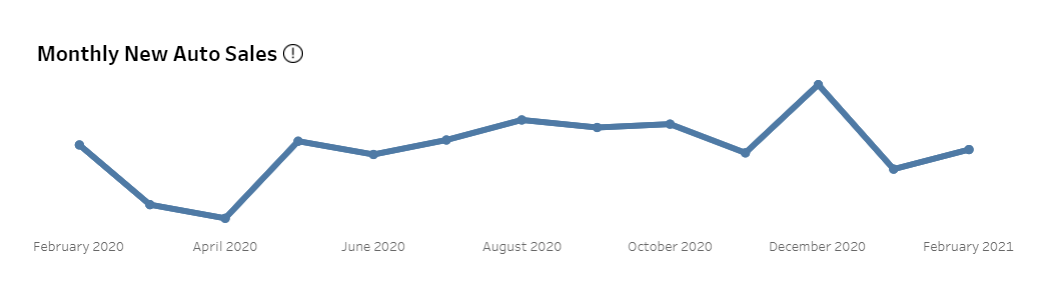
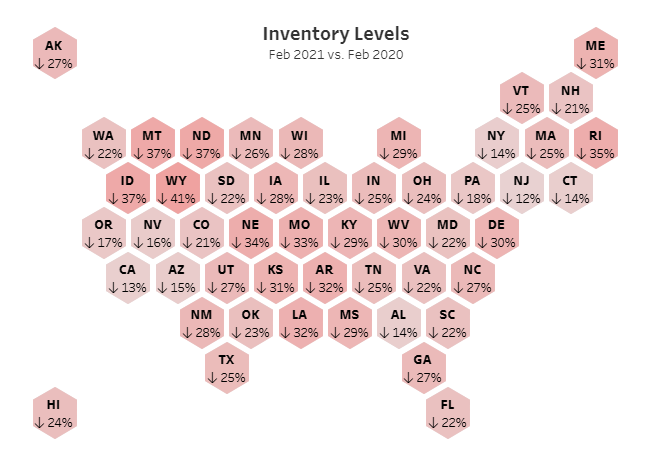
This month, we can see that despite year-over-year inventory levels being down -23%, YoY new car sales remain relatively steady.
Monthly New Auto Sales
Monthly Inventory Levels
Visit the dashboard to explore the data and let us know what you think!
No Comments
Foureyes
Pricing Trends on 2020 & 2021 Models
 Things are picking up as we head into the end of the year! Looking at inventory and pricing trends nationwide, as of last week:
- 2021 models make up 32.2% of new in-stock inventory. This time last month, 2021 models made up just 16.5% of new in-stock inventory.
- 2021 models have an advertised discount of 4.1% on average. This time last month, 2021 models had an advertised discount of 2.8% on average.
Digging into advertised discounts on dealership websites from the last week, here’s what we’re seeing by OEM for 2020 and 2021 models. Does this align with what you’re seeing or any surprises?
|
Average Promoted Discount Off MSRP |
||
|
Dealership Type |
2020 Models |
2021 Models |
|
Ford |
13.3% |
2.7% |
|
GM |
12.7% |
5.1% |
|
Nissan |
11.4% |
5.4% |
|
FCA |
11.0% |
6% |
|
Kia |
10.3% |
6.8% |
|
Hyundai |
9.0% |
5.6% |
|
VW |
7.3% |
4.4% |
|
Mazda |
7.0% |
2.2% |
|
Toyota |
5.1% |
2.6% |
|
Subaru |
2.1% |
1.2% |
|
Honda |
1.4% |
1.3% |
|
BMW |
1.7% |
0.1% |
|
JLR |
0.9% |
0.5% |
|
Mercedes-Benz |
0.2% |
0.2% |
Curious to poke around in the data yourself? Foureyes aggregates data from more than 16,500 franchise dealerships nationwide and shares the results in interactive dashboards that include pricing, inventory, and sale insights for the automotive industry. Dashboards are updated weekly.
No Comments
Foureyes
Comparing 2021 Inventory Levels Across Auto Brands
 There has been so much talk and speculation around low inventory levels, making questions around the model year transition even more important this year. Which brands will get 2021 inventory out faster than everyone else? How will inventory availability affect typical pricing strategies? And how can we use Foureyes data to help OEMs and dealers feel informed and stay competitive as we finish out the summer and look to the end of the year?
Foureyes recently compiled a new, interactive data set to help answer these questions and more. Looking at May-September data from more than 16,500 franchise dealerships across the country, here’s what we’ve seen so far:
-- As of September 7, 2021 models make up 13% of the new vehicle market; however, different automotive brands have dramatically different levels of 2021 inventory at dealerships.
-- Of the 14 automotive brands in our data set, Kia has the largest amount of in-stock 2021 inventory. 2021 models make up about half of new inventory across Kia dealerships today. Here’s how the rest stack up:
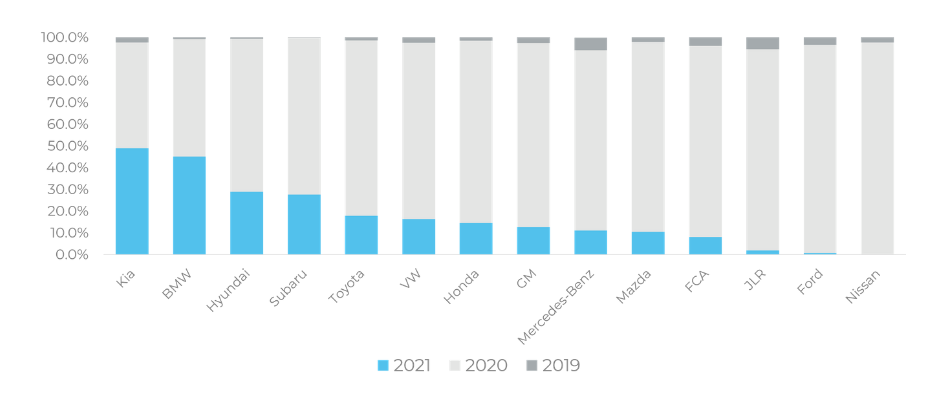
Kia: 49.0%
BMW: 45.1%
Hyundai: 29.0%
Subaru: 27.6%
Toyota: 17.9%
VW: 16.4%
Honda: 14.6%
GM: 12.6%
Mercedes-Benz: 11.1%
Mazda: 10.5%
FCA: 8.1%
JLR: 1.9%
Ford: 0.7%
Nissan: 0.2%
- How do these numbers compare to inventory at your dealership? Do you have 2021 inventory in-stock or are you experiencing delays? Any trends that stand out to you?
No Comments
Foureyes
State-Specific Auto Sales Data
 Foureyes released a new state-specific data visualization to help you better understand sales trends by metro area, week, and OEM. Explore it here: https://lps.foureyes.io/auto-states-during-covid-19
Similar to the original COVID-19 dashboard and shelter-in-place data, this interactive dashboard enables dealers to understand the effects of novel coronavirus on new and used auto sales. To explore the data, choose a state from the dropdown and hover over the map to review month-over-month sales trends. Double-click or zoom in to see sales performance by ZIP code. Scroll down to review sales performance by metro area, OEM, and week-over week.
Feel free to reach out with any questions.
2 Comments
Automotive Group
Interestingly, it shows us in Las Vegas only being down 0.5%
I have to assume its missing some data
Foureyes
The data is a month-over-month comparison (April vs. March 2020), which may explain the 0.5% decrease. If you have additional questions or want to take a deeper dive into the data, let me know and I'd be happy to set something up.
Foureyes
The Effects of COVID-19 on Auto Sales
 We use publicly available data to power Foureyes products, including new car sales data. With the rapid changes from COVID-19, we're sharing it out in an interactive format for those of you trying to make informed decisions and understand sales trends at a market level.
Toggle between state, OEM, and date tabs to explore the interactive map. Feel free to reach out with questions. Data is refreshed weekly: https://lps.foureyes.io/auto-sales-during-covid-19
No Comments
No Comments